Exploring Bacterial Diversity in Hospital Environments by GS-FLX Titanium Pyrosequencing
Margarita Poza*, Carmen Gayoso*, Manuel J. Gómez**, Soraya Rumbo-Feal*, María Tomás*, Jesús Aranda*, Ana Fernández*, and Germán Bou*
*Laboratorio de Microbiología. Instituto de Investigación Biomédica de A Coruña (INIBIC) -
Servicio de Microbiología. Complejo Hospitalario Universitario A Coruña (CHUAC).
As Xubias s/n, 15006 A Coruña, Spain.
**Centro de Astrobiología, INTA-CSIC. Ctra. Ajalvir, Km. 4, Torrejón de Ardoz, 28850 Madrid, Spain.
Supplementary information
| Dataset A Hierarchical taxonomy distribution and representative sequence database for ICU and Hall sequences clustered into OTUs defined at a distance of 0.03. | 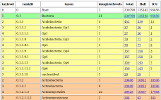
|
| Table A Identification of differentially distributed taxons. The table shows, for each taxon, the number of associated reads after pre-processing and classification, as well as the corresponding normalized values, the relative difference (rd), the value of the Chi-Square test and the calculated p-value. Only taxons associated with p-value < 5.0E-2 are included. | 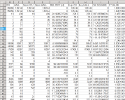
|
| Table B Microorganisms isolated from clinical samples obtained from ICU patients during the experimental period. | 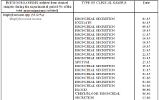
|
| Figure A Hierarchical taxonomy distribution chart for ICU sequences clustered into OTUs defined at a distance of 0.03. | 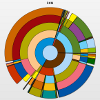
|
| Figure B Hierarchical taxonomy distribution chart for Hall sequences clustered into OTUs defined at a distance of 0.03. | 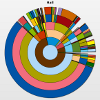
|
| Figure C Hierarchical taxonomy distribution chart for combined ICU and Hall sequences clustered into OTUs defined at a distance of 0.03. The color code represents taxon abundance relative differences between the two locations. | 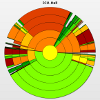
|
| Figure D Hierarchical taxonomy distribution chart for Patient isolates. | 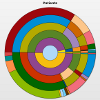
|